
Analyze · methods
Analytical method development and validation
Feasibility studies, optimization, development and validation: from signal to a method that stands up to audit.
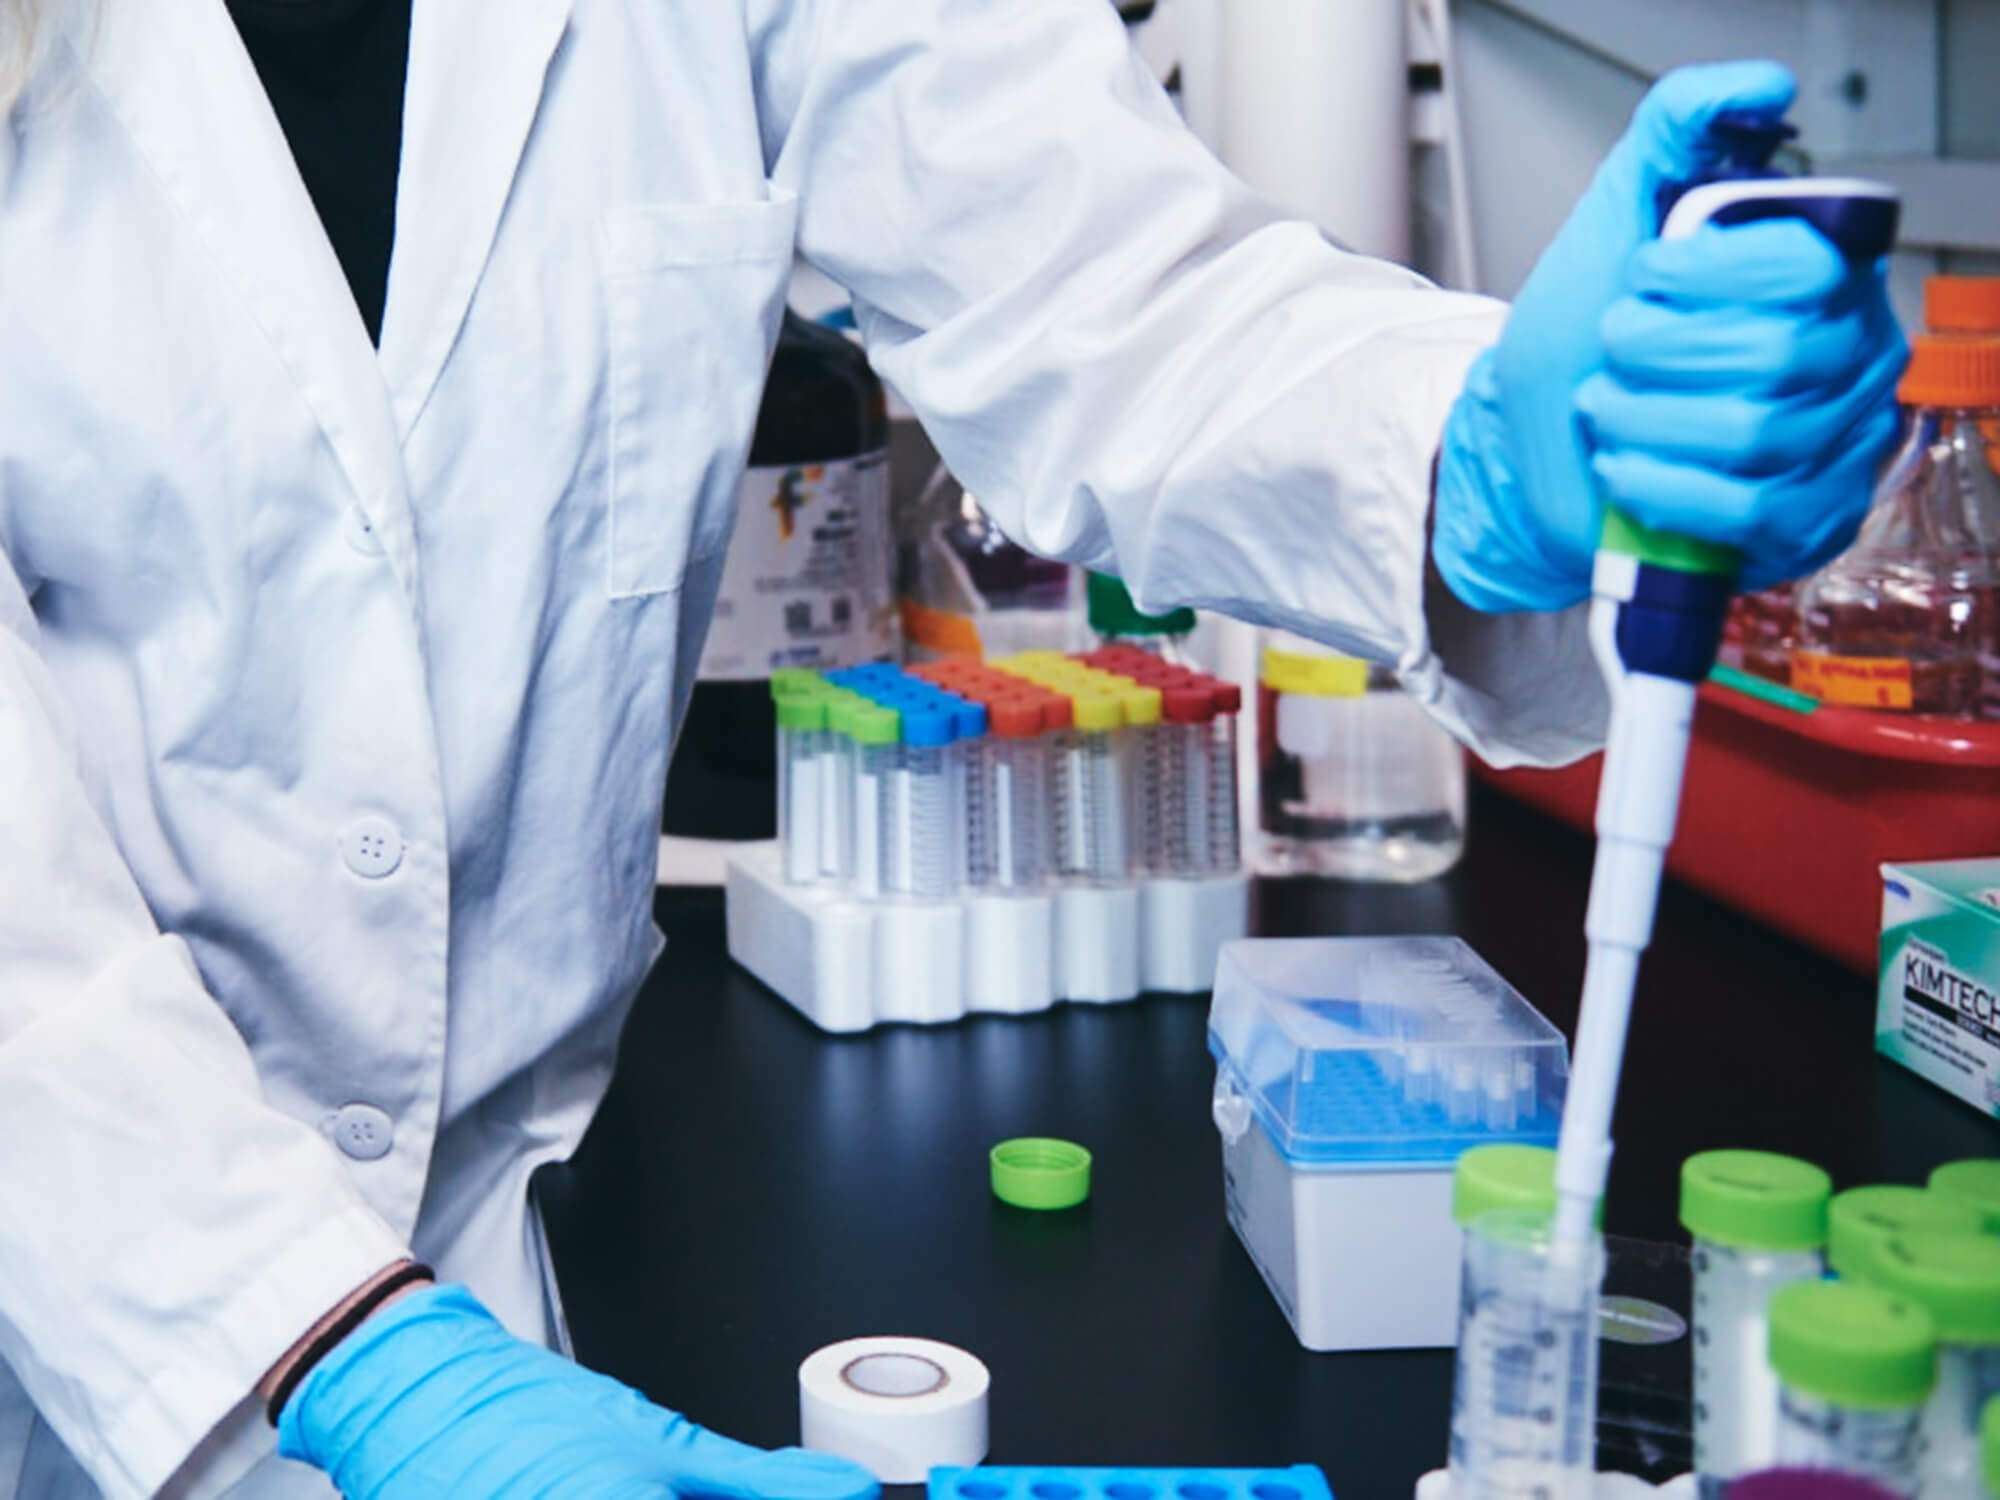
Pipetting samples at the preparation bench
An analytical method is a journey. First you verify that the measurement is possible on your matrix, then the method is optimized, validated in accordance with ISO/IEC 17025 and transferred to the people who will use it every day. DaSP works alongside the laboratory along the whole journey.
- 457 analytical methods developed in Italian laboratories
- 229 feasibility studies
- Validation according to ISO/IEC 17025, documented in a dossier
What we do
Feasibility study
Before investing, the answer to one question: this analyte, in this matrix, at this limit — can it be measured? Tests on the system, data in hand, written outcome.
Method optimization
A method that already exists but underperforms: long run times, peaks that get dirty, limits not reached. We work on sample preparation, chromatography and source parameters.
Method development
From the choice of column and mobile phases to the MRM transitions, up to the written protocol: the method is born on the laboratory’s system and with its samples.
Validation and transfer
Linearity, limits of detection and quantification, selectivity, precision, trueness: the tests ISO/IEC 17025 requires, collected in a dossier. Then the transfer to the people and their training.
From signal to validated method
Four validation parameters, read on real data. Each figure shows what is verified and why.
Linearity
The first parameter: the signal grows linearly with concentration over the whole working range. The coefficient of determination measures it.
Calibration curve
Linearity: homocysteine calibration curve, area ratio against concentration ratio, r² = 0.991Data: SCIEX, official application material Working range and limit of quantification
The blank tells you how much noise there is. The lowest level that can be told apart from the noise with the required precision is the limit of quantification (LOQ); the highest closes the working range.
XIC · calibration series
Working range: vitamin A from 0.76 to 3.76 µmol/L and vitamin E from 6.76 to 44.20 µmol/L, with the blank highlightedData: SCIEX, official application material Selectivity
Two molecules with the same mass and the same transitions can be told apart only if the chromatography separates them. Here the epimer elutes nine seconds after the main compound.
XIC · MRM
Selectivity: 25-OH-vitamin D3 and 3-epi-25-OH-vitamin D3 separated chromatographically, at 3.62 and 3.77 minutesData: SCIEX, official application material Verification at the limit
At the lowest level a peak must still be a peak: the signal-to-noise ratio and the repeatability of the area are verified, with the zoom showing what lies underneath.
XIC · MRM
Verification at the limit: 24,25-dihydroxyvitamin D3, 1,25-dihydroxyvitamin D3 and 1,25-dihydroxyvitamin D2, all at 5 pg/mL, zoomed in on the minor peaksData: SCIEX, official application material
How we work
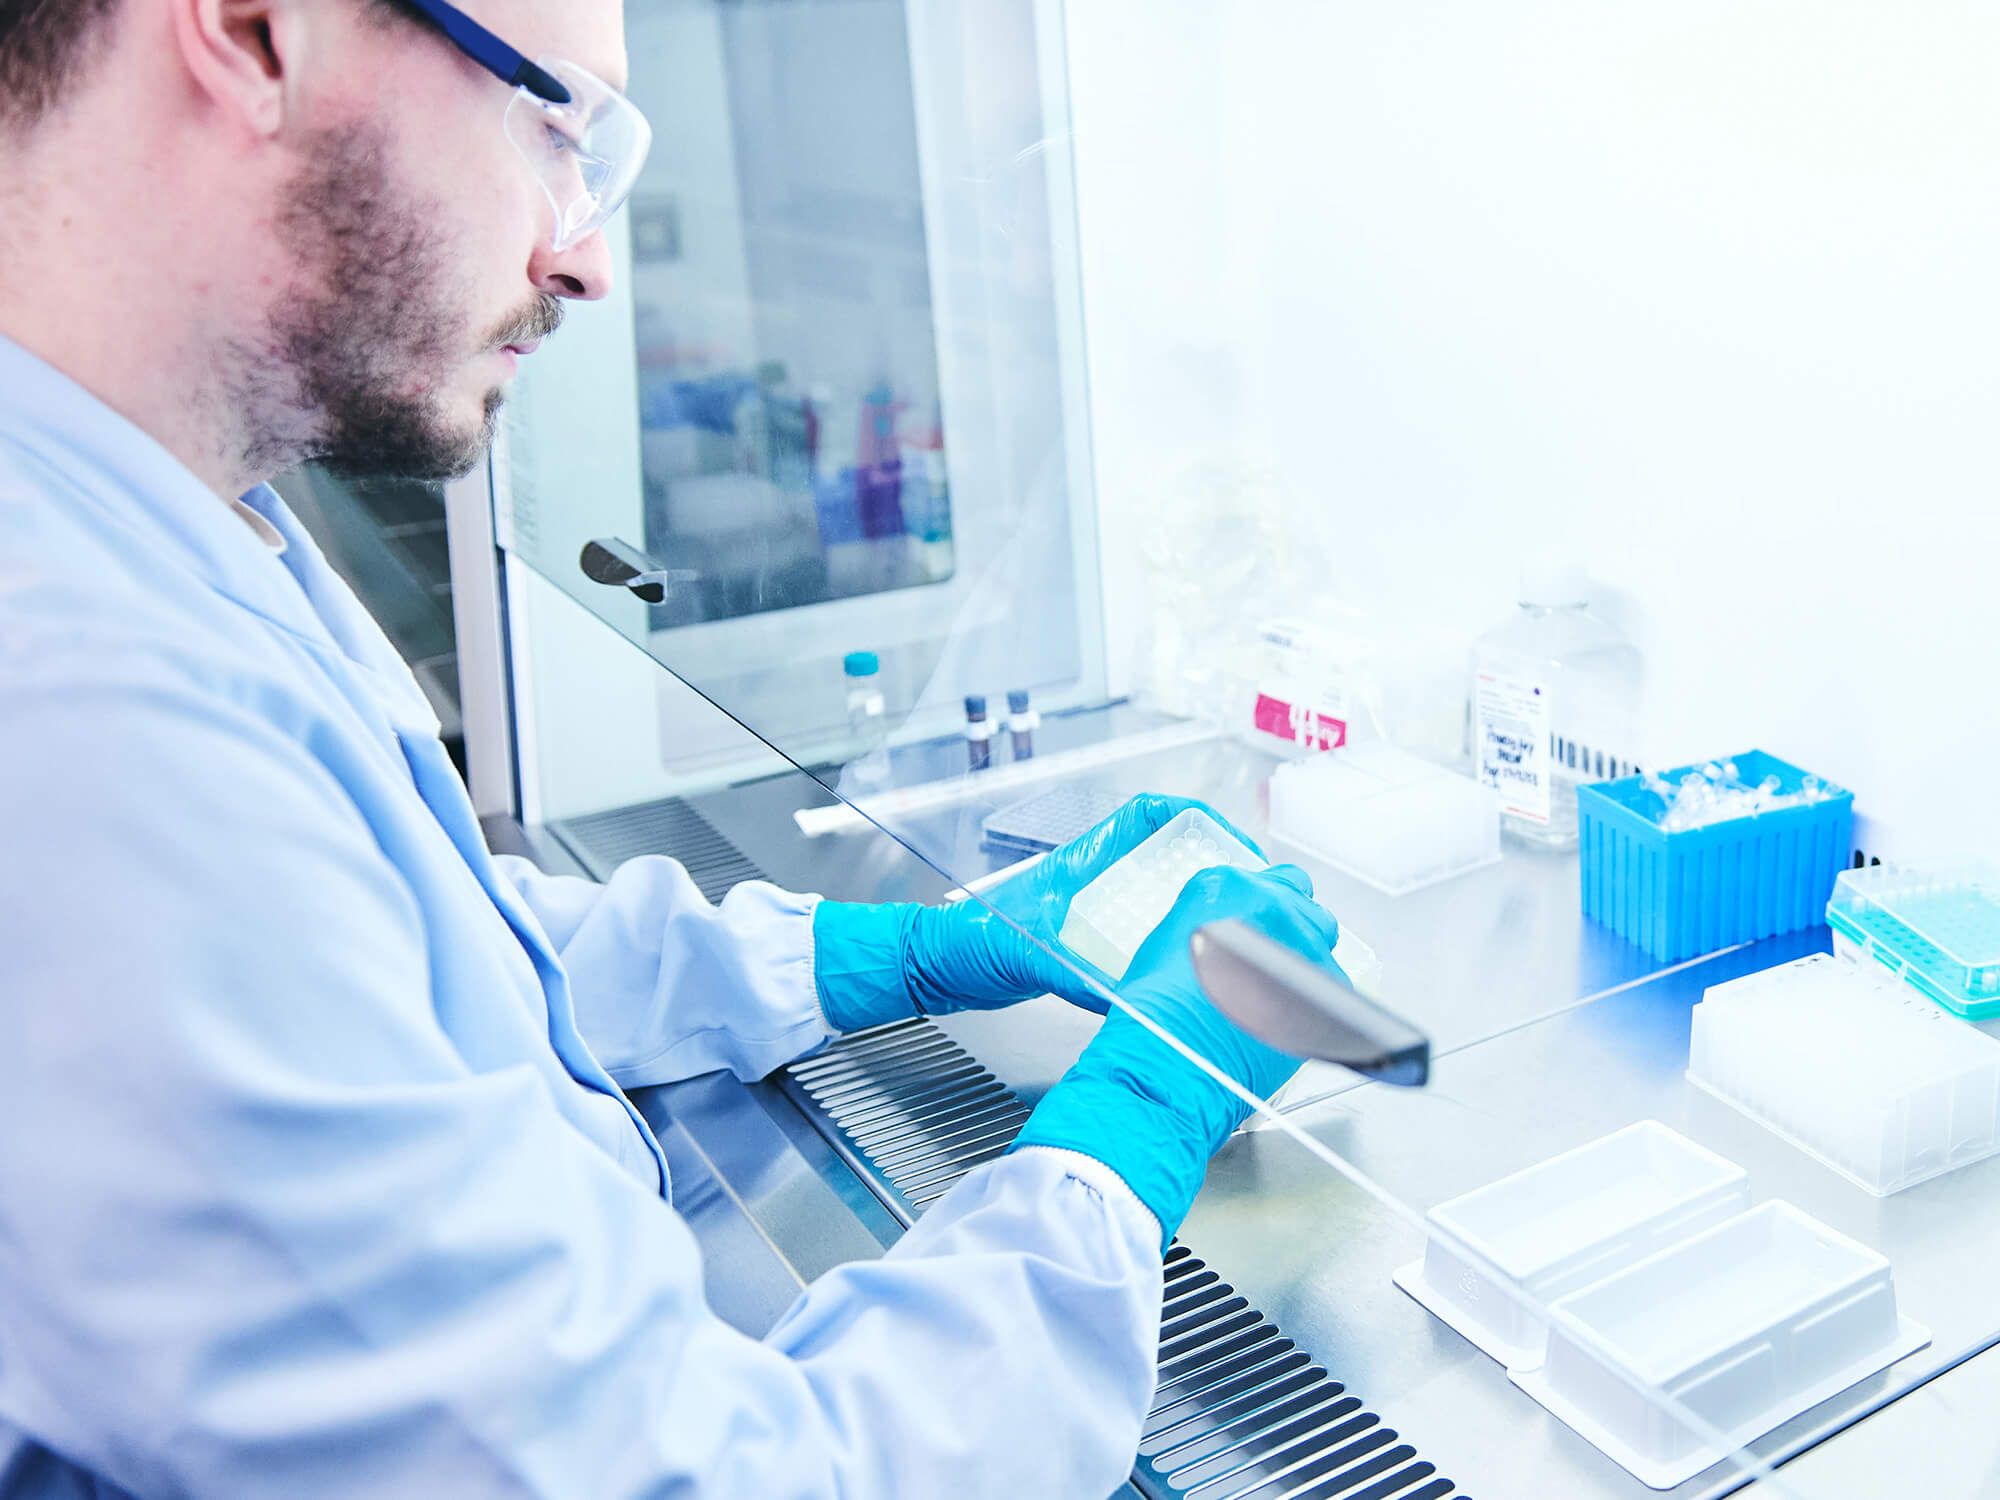
The method is born where it will be used: on the laboratory’s system, with its samples and its matrices.
- A single point of contact, from the feasibility study to the transfer.
- Every step documented: the dossier is built as the work is done, not at the end.
- The laboratory’s people take part in the development, so the method remains theirs.
What you receive
- The method protocol, written for the people who will run it
- The validation dossier with the tests required by ISO/IEC 17025
- The transfer of the method onto your system
- The training of the people who will use it
The questions we get asked
How long does a feasibility study take?
It depends on the analyte and the matrix. The study ends with a written outcome: measurable or not, at what limit, with what preparation. From there you decide whether to develop the method.
We already have a method, but it fails validation
It is the most frequent case. We start from the data you have: the problem is often in sample preparation or in matrix effects, not in the instrument. Optimization comes before validation.
Does the method then stay ours?
Yes. Protocol, parameters and dossier belong to the laboratory, and people are trained to use it and maintain it.
The method is validated: now it needs a quality system that keeps it alive. For accreditation and training, there is the Grow stage.
Tell us your analytical challenge
Analyte, matrix, limit to be met, instrument available: these four lines are enough to start.